Poison Statistics National Data 2013
Reports to U.S. Poison Control Centers
How Many?
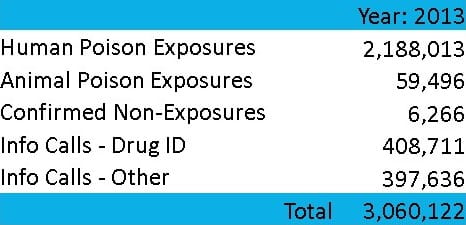
In 2013, the then 56 (now 55) U.S. poison control centers provided telephone guidance for nearly 2.2 million human poison exposures.1 That’s about:
- 6.8 poison exposures/1000 population,
- 43.7 poison exposures in children younger than 6 years/1000 children,
- 1 poison exposure reported to U.S. poison control centers every 14 seconds.
 |
What Ages are Affected?
While young children (younger than 6 years) comprise a disproportionate percentage of the cases, poisoning affects ALL age groups, from infants to seniors. Peak poisoning frequency occurs in one and two year olds, but poisonings in teens and adults are more serious. Notice that the greater proportion of males in poison exposures occurring in children younger than 13 years switches to a female predominance in teens and adults.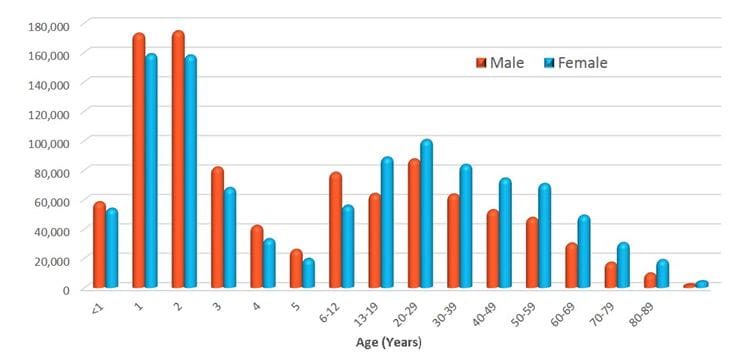 |
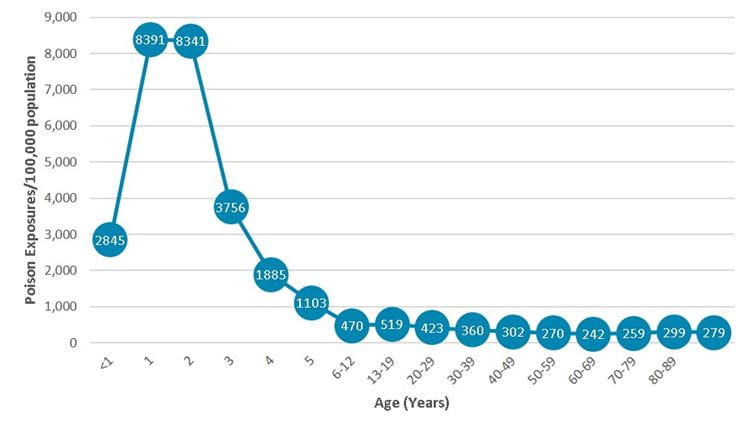
Across all ages, there were 684 poison exposures reported per 100,000 population. The highest incidence occurred in one and two year olds (8,391 and 8,341 exposures/100,000 children in the respective age groups). Adults aged 50 years or older averaged fewer than 300 exposures/100,000 population.1
 |
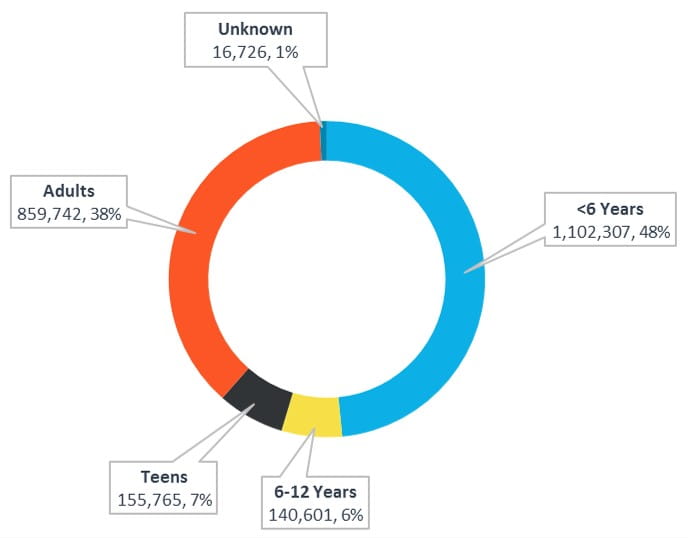
Children younger than 6 years comprise nearly half of poison exposures (48%), followed by adults (38%), then teens (7%).
 |
Why?
Across all ages, 80.0% of poison exposures reported to U.S. poison centers in 2013 were unintentional, 16.1% were intentional, and 2.5% were adverse reactions. In children younger than 6 years, 99% of exposures are unintentional, compared to only 39% of teen exposures and 62% of adult exposures. 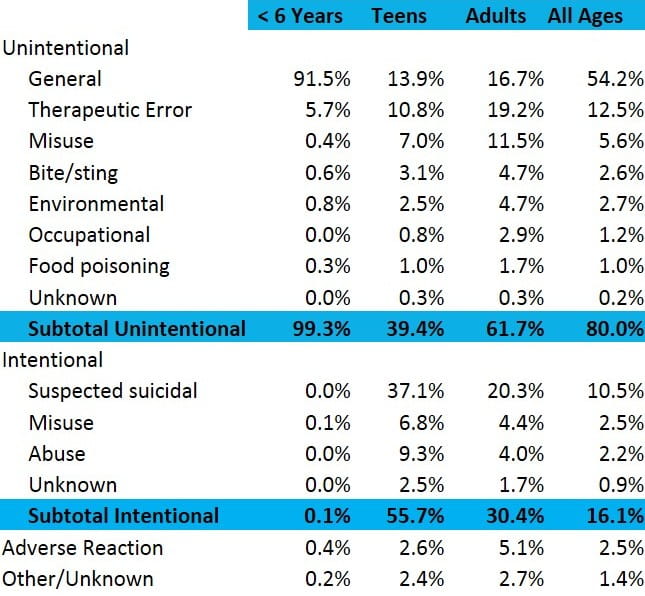 |
Most Common Substances Implicated in Poison Exposures?
Cosmetics and personal care products lead the list of the most common substances implicated in pediatric exposures (children younger than 6 years, NPDS, 2013). Cleaning substances and pain medications follow. These exposures are nearly always unintentional.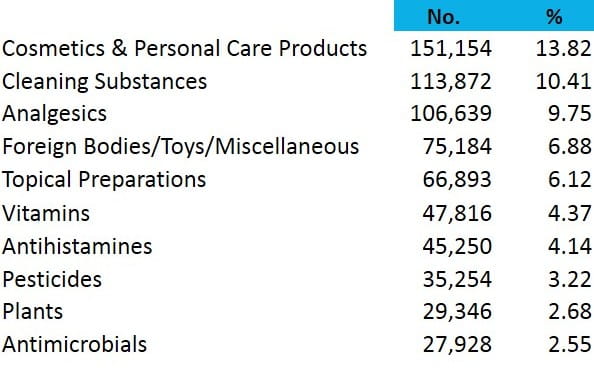 |
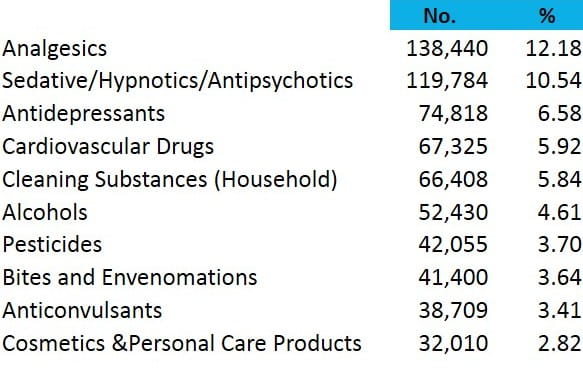
Pain medications lead the list of the most common substances implicated in adult poison exposures (20 years old or older, NPDS, 2013). Sedatives and sleeping medications, antidepressants, and cardiovascular medications follow. These exposures are often intentional.
 |
Most Serious Poisonings?
Frequency statistics are only a part of the poisoning story. To determine where to focus prevention efforts, we also need to know which poisonings are serious.
Pain medications are the single most frequent cause of pediatric fatalities reported to Poison Control. That's a skewed picture, because carbon monoxide deaths are under-reported. The table below shows poisoning fatalities reported to US Poison Control from 2008 through 2013.
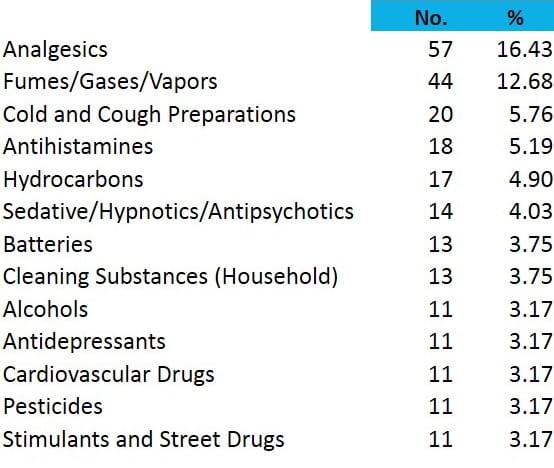 |
The substance categories with the largest number of deaths across all ages (and including intentional exposures) include acetaminophen-containing medications, sedatives and sleeping medications, cardiovascular drugs, opioids, stimulants and street drugs, and alcohols (NPDS, 2013).
How serious are poison exposures?
In 2013, 85% of poison exposures reported to U.S. poison centers were nontoxic, minimally toxic, or had at most a minor effect.(Includes the National Poison Data System codes: no effect; minor effect; not followed, nontoxic; and not followed, minimally toxic.)
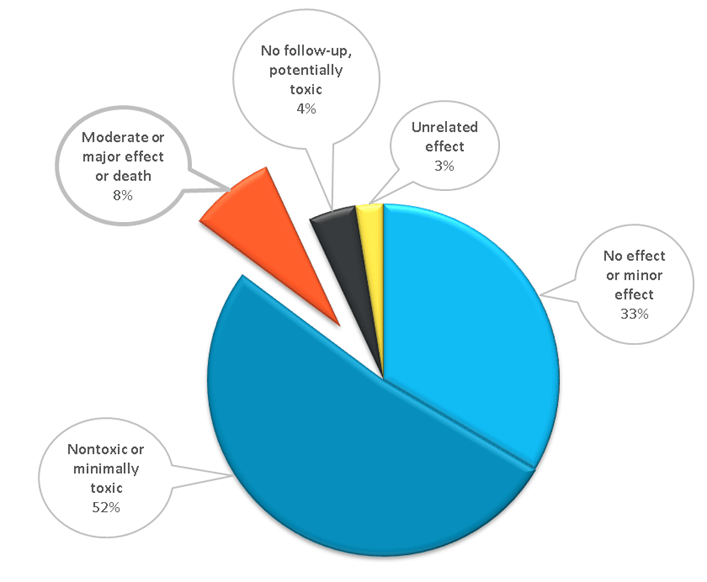 |
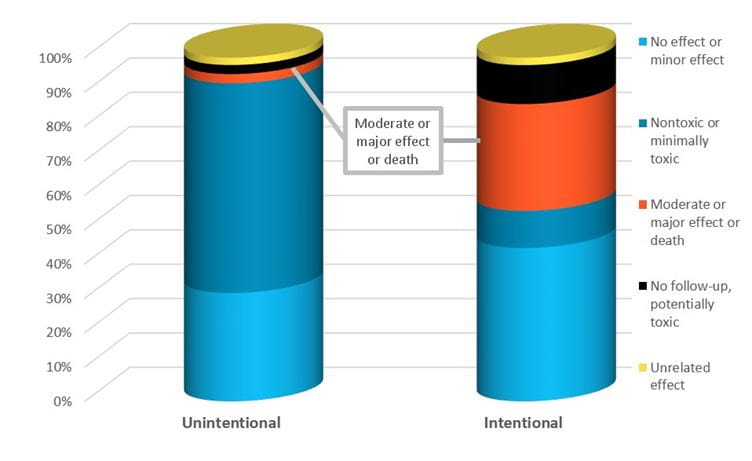
Intentional exposures were significantly more serious, with a 31-fold greater percentage of serious outcomes (major or fatal effects) compared to unintentional exposures. Of the intentional exposures, 5.0% were major effects or deaths compared to 0.2% of unintentional exposures and 1.1% of all exposures. Just 2.7% of unintentional exposures had a moderate, major or fatal outcome compared to 31.1% of intentional exposures and 7.9% of all exposures.
 |
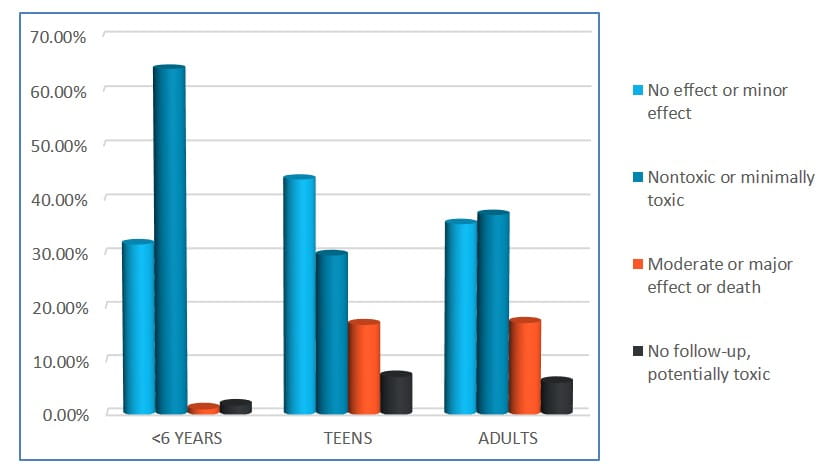
Exposures in teens and adults were also considerably more serious, with 16.8% of teens and 17.2% of adults having a moderate, major or fatal effect compared to 1.1% of children younger than 6 years. Most exposures in children younger than 6 years (95.8%) were nontoxic, minimally toxic, or had at most a minor effect.
 |
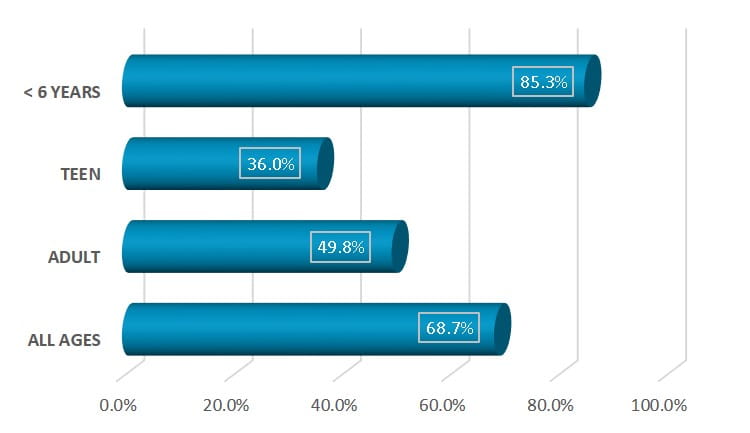
Many poison exposures can be safely observed at home, without an ER visit. Overall, 68.7% of poison exposures were observed without medical intervention in 2013. For poison exposures occurring in children younger than 6 years, 85.3% were only observed at home (without going to an ER or seeing a physician). In contrast, only 49.8% of adults were managed at the exposure site without medical intervention.
 |
These nontoxic or minimally toxic poison exposures that can be safely observed at home are the cases that will most likely be amenable to triage by webPOISONCONTROL®.
Real-time poison exposure data enables surveillance
U.S. poison centers collect data in real time and upload those data every 8.1 minutes (median time to upload). Real-time data are used to find hazardous products quickly, follow substance abuse trends, and detect chem/bioterrorism incidents. Under a grant from the CDC, the American Association of Poison Control Centers and its member poison centers conduct automated, continuous surveillance of poison exposure cases. Alerts are sent when there are an unexpectedly large number of cases in an hour, when there’s an unexpectedly high frequency of a specific symptom, or when there are cases with combinations of clinical effects suggestive of specific poisonings that might require a rapid public health response. Toxicologists promptly investigate these alerts and inform public health officials if outliers are suspicious for events or products of concern.
For more detailed U.S. poison control data, check out the Annual Reports of the American Association of Poison Control Centers:
| 2014 | 2013 | 2012 | 2011 | 2010 | 2009 | 2008 | 2007 | 2006 | 2005 | 2004 | 2003 |
| 2002 | 2001 | 2000 | 1999 | 1998 | 1997 | 1996 | 1995 | 1994 | 1993 | 1992 | 1991 |
| 1990 | 1989 | 1988 | 1987 | 1986 | 1985 | 1984 | 1983 |
Other U.S. Poisoning Data Sources
In 2010, CDC reported 33,041 unintentional poisoning deaths in the U.S. and another 6,599 poisoning suicides. Unintentional poisoning was the second leading cause of injury deaths in all age groups and the leading cause of injury deaths in 25 to 64 year olds.2 The graph below3 shows that poisoning fatalities (including intentional and unintentional cases) have exceeded motor vehicle traffic fatalities since 2008, and drug poisonings, responsible for nearly 9 out of 10 poisoning deaths, have exceeded motor vehicle traffic fatalities since 2009. In 2010 78% of drug poisoning deaths were unintentional, 14% were suicides and 8 percent were of unknown intent. 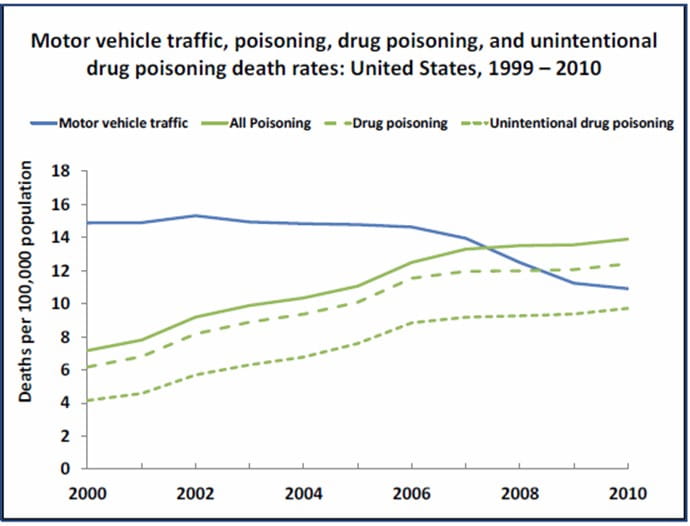 |
Unintentional poison deaths are on the rise in the U.S., increasing 160% from 1999 to 2009. Most (91%) of unintentional poisoning deaths are a result of drug overdose – especially from opioid pain medications such as methadone, hydrocodone or oxycodone. Nearly 15,000 people died in 2008 from overdoses involving prescription pain killers – a more than 3-fold increase over a decade. In fact, in 2010, the number of deaths from prescription opioid or narcotic pain relievers - including drugs such as Vicodin (hydrocodone), OxyContin (oxycodone), Opana (oxymorphone), and methadone – exceeded the number of overdose deaths from heroin and cocaine combined. And for every one of those nearly 15,000 prescription painkiller deaths reported in 2008, there were 10 treatment admissions for abuse, 32 emergency department visits for misuse or abuse, 130 people who abuse or are dependent, and 825 nonmedical users.4
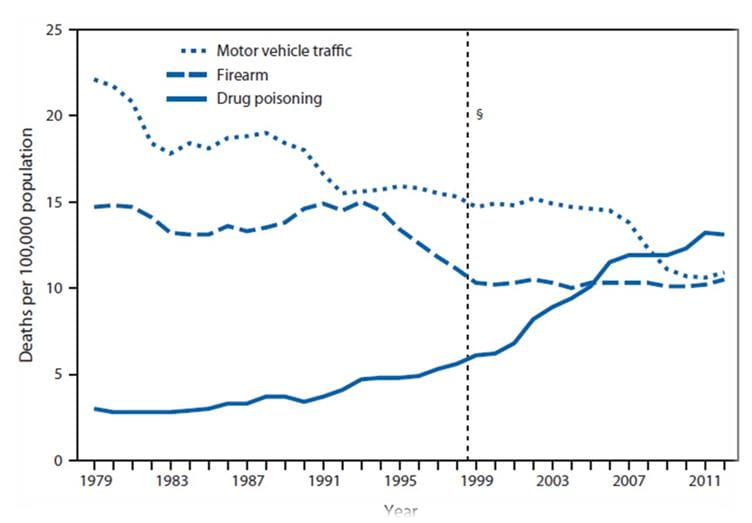
The figure below shows trends for the three most common causes of injury death in the U.S. - motor vehicle traffic, firearm and drug poisoning.5 In 2012 there were 41,502 drug poisoning deaths reported, and since 2009, the rate of drug poisoning deaths has exceeding both motor vehicle traffic deaths and firearm deaths. The age-adjusted death rate for drug poisoning has increased from 3.0 per 100,000 in 1979 to 13.1 per 100,000 in 2012.5 During this same period, the age-adjusted rate for motor vehicle traffic deaths dropped by half and firearm deaths also declined.
 |
Carbon monoxide is another poisoning issue that deserves special mention. At least 430 people die in the US each year from unintentional, non-fire related carbon monoxide poisoning. The average annual death rate from carbon monoxide is nearly three times higher in males than females, and the death rate is highest among men age 65 and older.6
AAPCC Data Disclosure Statement
Related Links
Summary of National Poison Statistics, Reports to U.S. Poison Control Centers
Keeping Families Safe Around Medicine, SafeKids Worldwide, March 2014
References
1 Mowry JB, Spyker DA, Cantilena LR, McMillan N, Ford M: 2013 annual report of the American Association of Poison Control Centers’ National Poison Data System (NPDS): 31st annual report. Clin Toxicol 2014; 52:1032-1283.
2 10 Leading Causes of Injury Deaths by Age Group Highlighting Unintentional Injury Deaths, United States - 2010. U.S. Centers for Disease Control and Prevention.
3 NCHS Data on Drug Poisoning Deaths. U.S. Centers for Disease Control and Prevention.
4 Policy Impact: Prescription Painkiller Overdoses. U.S. Centers for Disease Control and Prevention.
5 QuickStats: Death rates for three selected causes of injury – National Vital Statistics System, United States, 1979-2012. MMWR 2014;63(46):1095.
6 QuickStats: Average Annual Number of Deaths and Death Rates from Unintentional, Non-Fire-Related Carbon Monoxide Poisoning, by Sex and age Group - United States, 1999-2010. MMWR 2014; 63(03):65.
Poisoned? Get Expert Help Online
Don’t guess what you should do. Get accurate answers prepared by poison control experts. This tool will guide you. It’s free. It’s confidential.
Subscribe to The Poison Post®
The Poison Post® is a free, quarterly e-newsletter delivering poison prevention tips right to your inbox!
Support Us
webPOISONCONTROL® is funded entirely through generous private contributions. Your donation to our 501(c)(3) charitable organization will help us maintain and expand this free service so that others can get life-saving help for poison exposures.